


The MediGulf countries, together with Iran and Iraq, account for a substantial share of global production and exports of crude oil, liquefied natural gas (LNG) and refined petroleum products. These energy commodities are predominantly shipped through the Strait of Hormuz, the narrow maritime passage connecting the Persian Gulf with the Arabian Sea, which represents the only direct outlet to international waters for most Gulf exporters. Under normal conditions, around 20 percent of the world’s oil supply and a comparable share of global LNG trade pass through this critical maritime corridor each day.
A similar dependence characterizes global fertilizer trade. Approximately one-third of internationally traded urea, together with around 20 percent of ammonia and phosphate exports (IEA, 2026), is transported through the Strait of Hormuz. This reflects the prominent role of Gulf producers — including Qatar, Saudi Arabia, Iran and the United Arab Emirates (UAE) — which benefit from abundant and relatively inexpensive natural gas used as a key input in fertilizer production.
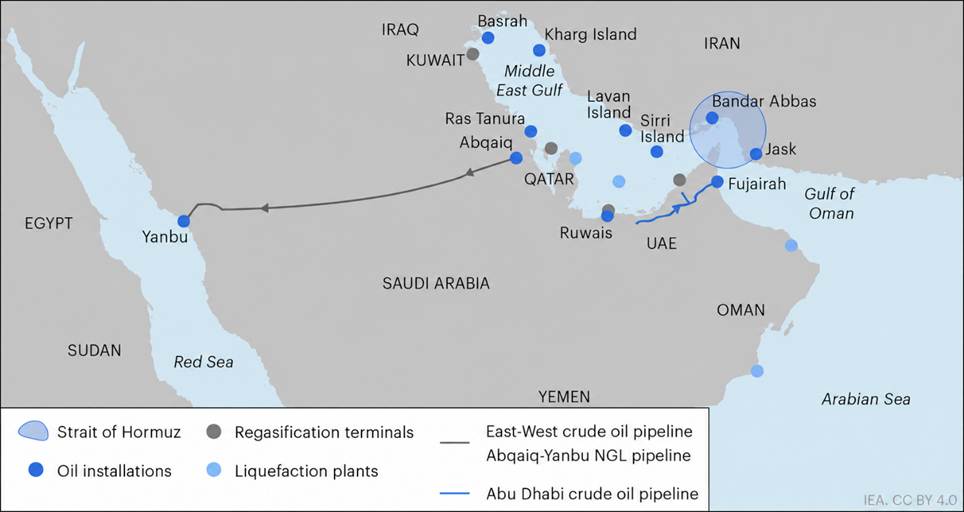
Among these exporters, only Saudi Arabia and the UAE possess pipeline infrastructure capable of partially bypassing the Strait. However, their spare capacity is limited to approximately 5.5 million barrels per day, equivalent to about a quarter of the region’s typical export volume. As a result, Iran, Iraq, Kuwait, Qatar, Bahrain and the remaining Gulf producers remain overwhelmingly dependent on the Strait of Hormuz, as illustrated in Map 1 based on FAO (2026b).
MAP 1 Alternative Routes for Oil Exports
Measuring Economic Uncertainty
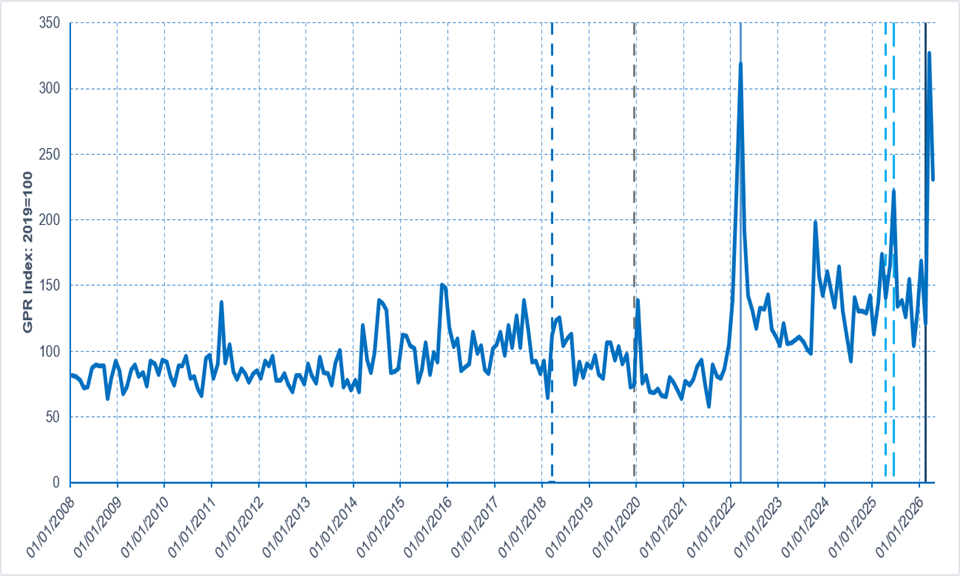
This disruption rapidly transmitted volatility to global energy markets and the broader agrifood system, generating elevated economic uncertainty. This is captured by the Geopolitical Risk (GPR) index, which measures adverse geopolitical events and related risks through a systematic count of newspaper articles published in ten major international newspapers, as described by Caldara & Iacoviello (2022).
Chart 1 reports the evolution of this indicator from the onset of the Great Financial Crisis (GFC) to early 2026. Six major geopolitical events are highlighted with vertical dotted lines, each associated with a marked increase in the index. The first notable rise followed the onset of the US–China trade war under the first Trump administration in March 2018, when the GPR index increased from 112 to 126 within two months. A more pronounced jump occurred with the emergence of Covid-19 in China: after standing at 78 in December 2019, the index surged to 138 in January 2020. More recently, the announcement of a 10% increase in US import tariffs (“Liberation Day,” 2 April 2025), followed by the outbreak of the “Twelve-Day War” and the US bombings of Iranian nuclear facilities in June 2025, pushed the index up by almost 57% within two months, reaching a value of 221.
The largest episodes of geopolitical uncertainty, however, were associated with military conflicts. Following Russia’s invasion of Ukraine, the GPR index climbed to 319 in March 2022 before declining rapidly to 117 by July, suggesting that the initial shock had gradually subsided. An even stronger reaction took place after the US–Israel strikes on Iran (28 February 2026), when the index reached its historical maximum of almost 327 in March 2026 before easing to 231 in the following month. Overall, the series exhibits a clear pattern of abrupt spikes in response to major geopolitical shocks, followed by relatively rapid declines as markets progressively adjusted, although the post-shock levels generally remained above their pre-event values.
CHART 1 GPR Index Trend at the Global Level, 2008-2026
Price Transmission between Natural Gas and Fertilizers
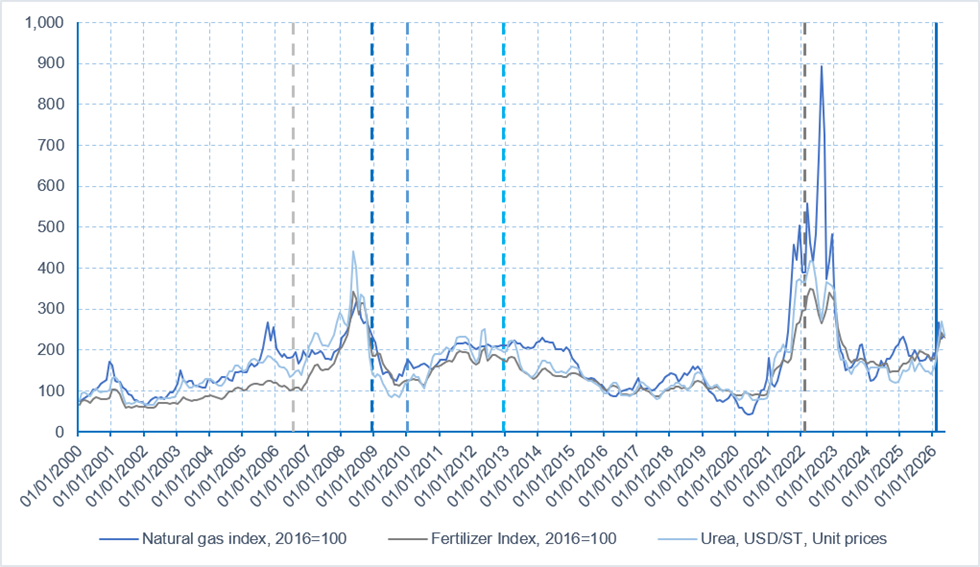
The latest escalation of geopolitical tensions was rapidly transmitted to global commodity markets, triggering sharp increases in oil and natural gas prices as concerns over potential supply disruptions tightened energy markets. Higher energy prices, in turn, raised production and transportation costs across a wide range of economic sectors, including agriculture. More precisely, natural gas is the principal input in the Haber–Bosch process used to produce nitrogen fertilizers, particularly ammonia and urea. The Persian Gulf region plays a pivotal role in global fertilizer markets, “accounting in recent years for an estimated 20–30 percent of world ammonia exports and 30–35 percent of global urea exports” (FAO, 2026a). As a result, fertilizer prices are closely linked to developments in natural gas markets, causing natural gas, ammonia and urea to display remarkably similar price dynamics, particularly during periods of heightened geopolitical and economic uncertainty. As illustrated in Chart 2 the prices of all three commodities peaked during the GFC and again following Russia’s invasion of Ukraine. More recently, the conflict involving Iran has also been accompanied by a renewed upward trend in these markets. In particular, according to FAO (2026b), the international price of urea increased by 56 percent relative to its pre-conflict level.
CHART 2 International Fertilizers and Natural Gas Prices Trend, 2000-2026
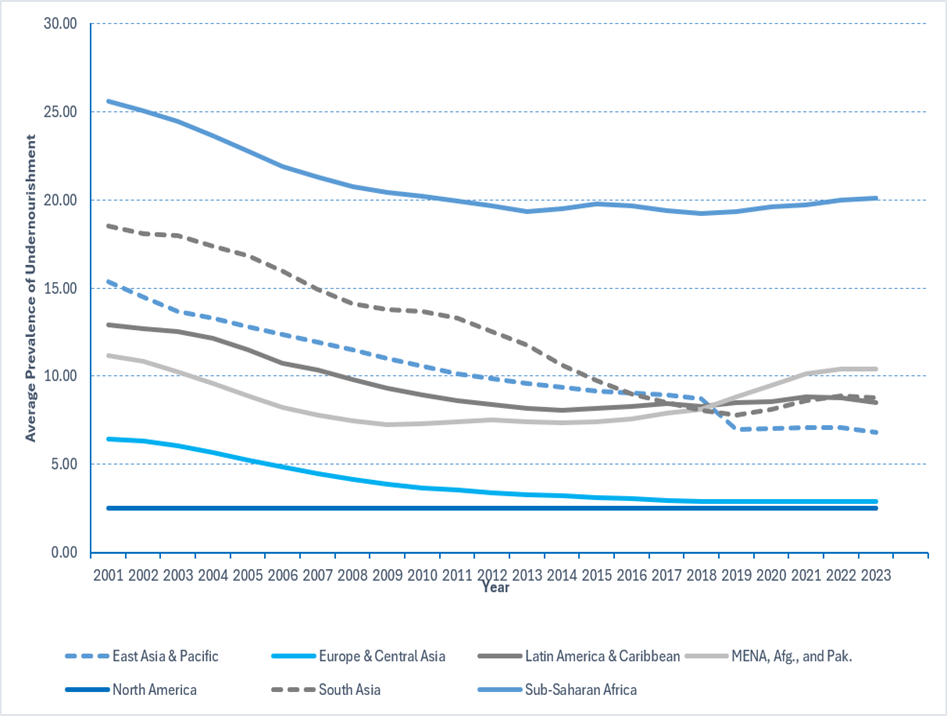
The surge in fertilizer and energy prices has substantially increased agricultural production costs, prompting farmers in many regions to reduce fertilizer application. Lower application rates can depress crop yields, thereby exacerbating food insecurity both directly, through lower domestic production, and indirectly, through reduced output in the world’s major cereal-exporting countries. These risks are particularly acute in the Middle East and North Africa (MENA) region, where food insecurity has worsened markedly in recent years. Chart 3 illustrates this pattern by reporting the evolution of the three-year average prevalence of undernourishment across world regions between 2001 and 2023, following the World Bank regional classification. The MENA region (including Afghanistan and Pakistan) exhibits a clear upward trend in undernourishment beginning around 2020, coinciding with the combined effects of the Covid-19 pandemic, climate-related disruptions and successive geopolitical shocks. This reversal contrasts sharply with the sustained decline observed from the early 2000s to the mid-2010s, a period characterized by improvements in agricultural productivity, poverty reduction and the expansion of social protection systems. As a result, MENA currently records the second-highest prevalence of undernourishment after sub-Saharan Africa, accounting for approximately 12.2 percent of the population compared with over 20 percent in sub-Saharan Africa.
CHART 3 Average Prevalence of Undernourishment (%) (three-year average) by Region, 2001-2023
MENA Region Vulnerabilities to Ongoing Shocks
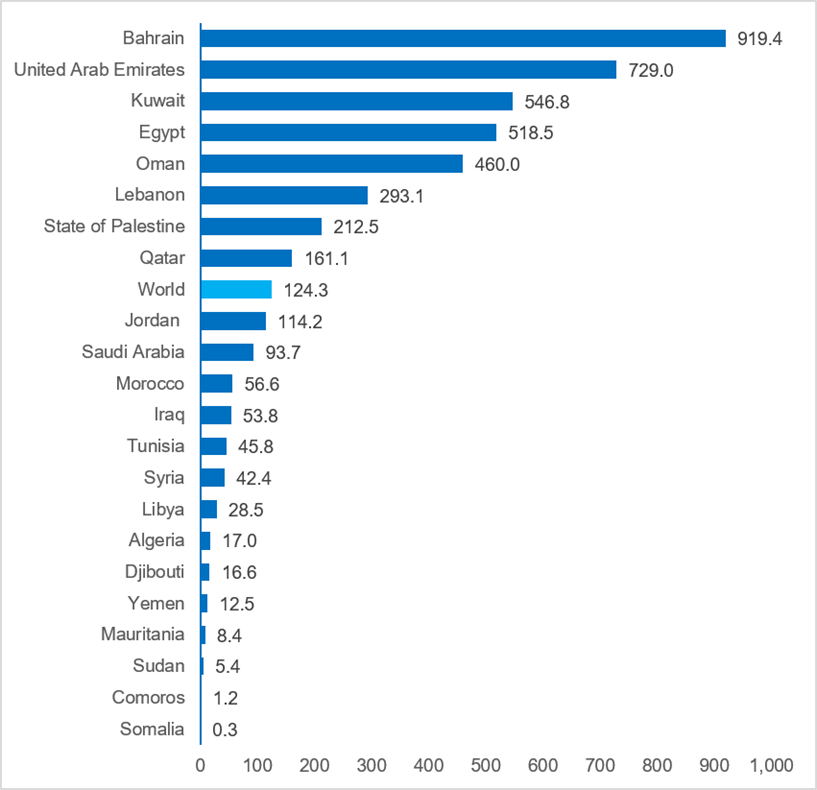
The region is particularly vulnerable because it combines two structural characteristics: agricultural production is highly dependent on fertilizer inputs, while a large share of domestic food demand is satisfied through imports from the world’s major cereal-exporting countries. Chart 4, based on UNCTAD (2025), shows that several MENA countries record fertilizer consumption levels above the global average. Egypt, Lebanon and Palestine all exceed the world average, while Jordan lies only slightly below it.
CHART 4 Fertilizer Use (kg/ha of arable land) in Arab Economies, 2025
At the same time, as documented by Odjo et al. (2025), Chart 5a shows that Egypt and Morocco are among Africa’s leading fertilizer exporters, while Chart 5b highlights that they also rank among the continent’s largest importers. This apparent paradox reflects the heterogeneity of fertilizer products and the fact that the intensive use of these agricultural inputs makes both countries highly exposed to disruptions in international markets. As illustrated in Chart 6, Morocco exports mainly phosphate-based fertilizers — primarily to Australia, India, Brazil, the United States, Djibouti and Bangladesh — whereas Egypt exports phosphatic fertilizers to Turkey, Brazil and several European countries, including France and Italy. However, both countries rely on imports of other essential fertilizer inputs to meet domestic agricultural demand: Morocco imports mainly ammonia and sulphur, whereas Egypt depends primarily on potash and urea.
CHART 5 Top 10 Traders of Fertilizers in Africa (US$ million)
a. Exporters
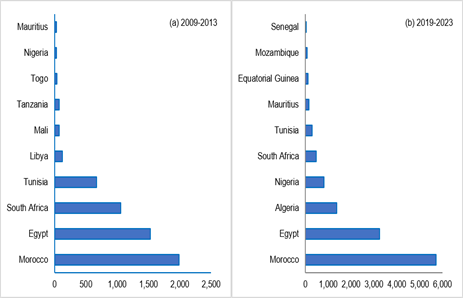
b. Importers
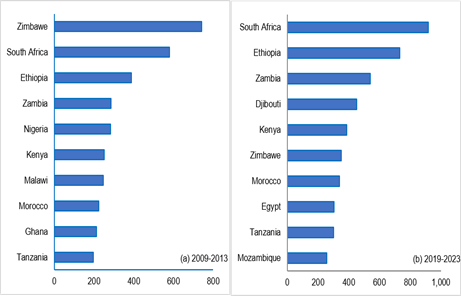
Note: Graphical representation taken from Odjo et al. (2025), Africa Agriculture Trade Monitor 2025.
CHART 6 Weighted Fertilizers Network for MENA Trade Partners, 2024 (MENA-centered view)
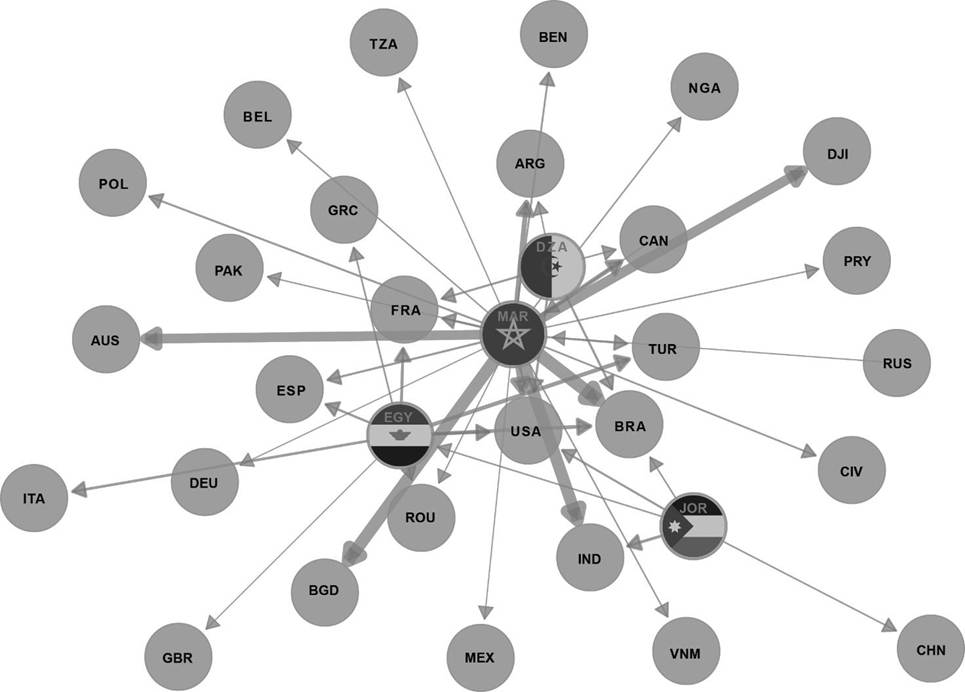
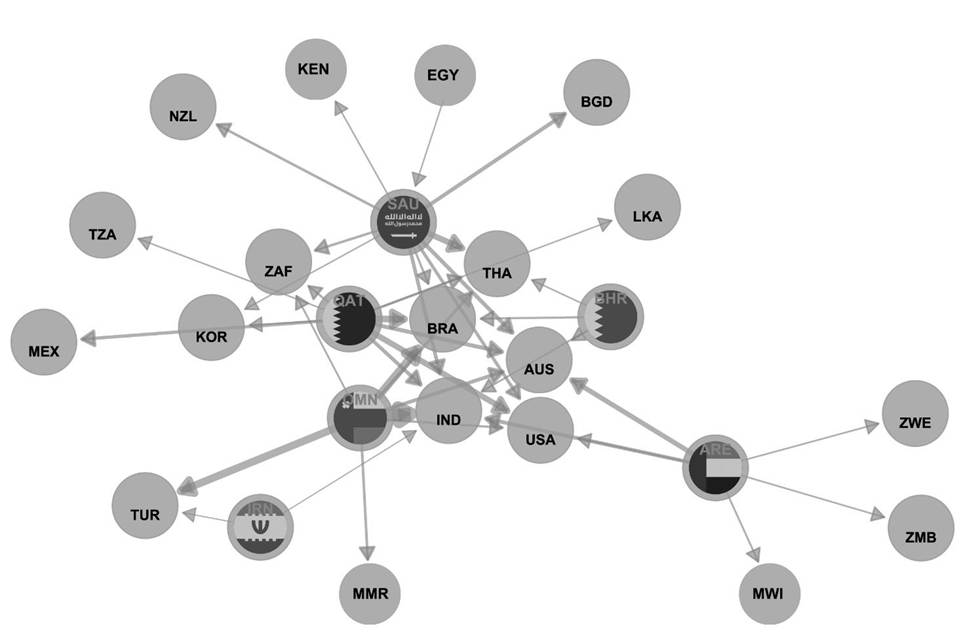
These interdependencies are further illustrated in Chart 7, which focuses on the Gulf economies within the global trade network for nitrogenous and phosphatic fertilizers, based on BACI–CEPII bilateral trade data for 2024. The network emphasizes Oman’s strongest trade links with India and Brazil, the world’s second- and sixth-largest exporters of unprocessed cereals, respectively (see Chart 8b).
Brazil also sources fertilizers from Qatar, while India maintains additional import relationships with Bahrain, the UAE and Saudi Arabia. In both countries, fertilizer security has become a policy priority: Brazil has introduced tax incentives, credit lines and investment programmes under its National Fertilizer Plan to strengthen domestic production of this strategic input, while India has combined increased domestic output with a diversification of import sources to stabilize prices. In addition, India has significantly expanded fertiliser subsidies, reaching approximately USD 18.1 billion in the current biennium.
A similar pattern emerges for the United States, which — despite being a major exporter of potassic fertilizers and a central hub in global unprocessed cereal trade — maintains strong fertilizer trade relationships with important Gulf economies, except Bahrain and Iran. This exposure has prompted policy efforts aimed at strengthening domestic fertilizer production, including the introduction of new support programmes providing grants and streamlining approval procedures. In addition, Turkey appears highly dependent on fertilizer imports from Oman and Thailand to support its agricultural production, while also maintaining additional trade links with Bahrain, Qatar and Saudi Arabia. Within the MENA region, Egypt stands out as a significant supplier of nitrogenous and phosphatic fertilizers to Saudi Arabia, whereas the other countries in the region show limited direct reliance on fertilizer imports from Gulf economies. However, the importance of Gulf fertilizer exports lies in their indirect transmission channel: disruptions affecting fertilizer availability in major cereal-exporting countries, such as Brazil and India, could reduce their production capacity and ultimately affect MENA food security. As shown in Chart 8a, these countries are key suppliers of unprocessed cereals to Egypt, Morocco, Algeria and Jordan, indicating that shocks to fertilizer markets can propagate through international trade networks even when direct regional exposure is limited.
CHART 7 Weighted Fertilisers Network for Gulf Trade Partners, 2024 (Gulf-centered view)
Indeed the chart below captures the second dimension of MENA countries’ vulnerability to the most recent ongoing shocks, namely the high reliance on external production of cereals to satisfy their internal demand for food. More precisely, Egypt, the world’s largest wheat importer, sources its unprocessed cereals primarily from three exporters: Russia, Ukraine and Brazil. Among these, Russia and Ukraine represent the fourth and third largest global hubs of unprocessed cereals, respectively, each accounting for slightly more than 7 percent of total world exports of these goods. Russia also remains a major supplier for Morocco and Tunisia. Similarly, Lebanon as well as Tunisia depends substantially on Ukrainian exports, while Algeria exhibits the most diversified sourcing pattern, importing cereals from Bulgaria, Brazil, Turkey, France, Argentina and Romania.
Romania plays a particularly important intermediary role in this network, acting as a transit hub for Ukrainian cereals through the European Union Solidarity Lanes, a mechanism introduced in May 2022 to facilitate Ukraine’s trade via alternative rail, road and inland waterway routes following the disruption of Black Sea shipping. As a result, Romania has become a key conduit for Ukrainian grain exports towards several destinations, including MENA countries such as Jordan.
CHART 8 Weighted Unprocessed Cereals Network for MENA Trade Partners and the Corresponding Top 10 Exporters, 2024
| a. Weighted Network-Unprocessed Cereals MENA-Centred View,Year 2024 | b. Top 10 Countries by Export Share of Unprocessed Cereals, Year 2024 |
GCC Remittance Losses and Food Security
The consequences of the Middle East crisis extend far beyond energy and fertilizer markets, reaching directly into household welfare through one of the key but often overlooked transmission channels: remittances. This channel is particularly relevant for MENA economies, given their deep economic and labour-market integration with the Gulf Cooperation Council (GCC) countries.
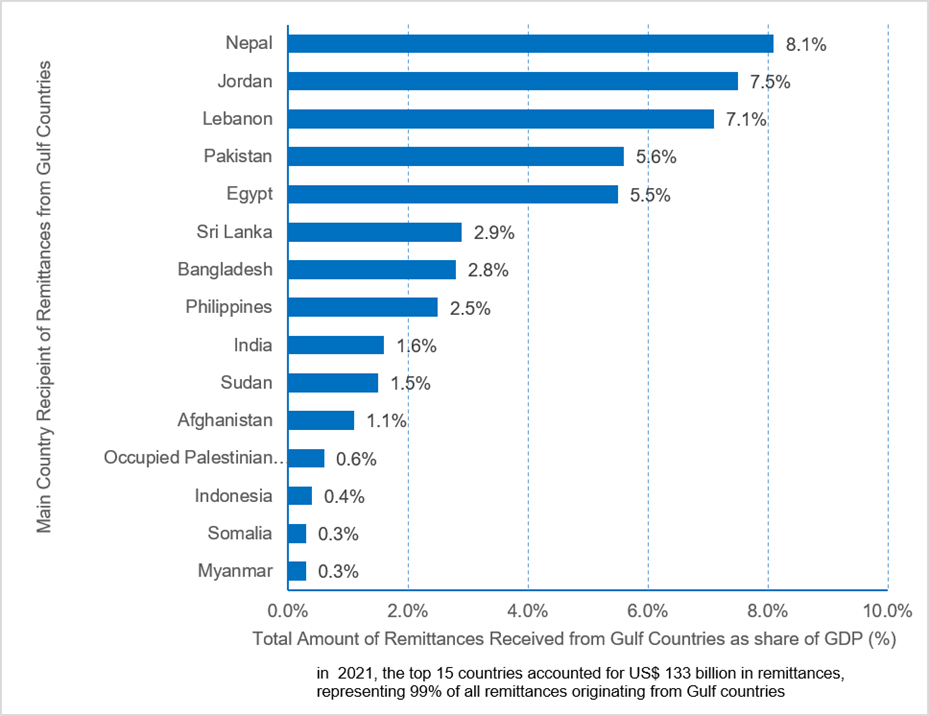
Within this region, reliance on these inflows is particularly pronounced. In 2021, Jordan and Lebanon stand out with remittances accounting for roughly 7.5% and 7.1% of GDP respectively, while Egypt also shows significant exposure at around 5.5%. These inflows play a central role in sustaining household consumption, helping to finance food purchases, education, healthcare, housing and small-scale entrepreneurial activity.
The GCC economies also operate as global remittance hubs, hosting more than 30 million migrant workers who transfer billions of dollars each year to households across South Asia, Southeast Asia, the Middle East and Africa. As illustrated in Chart 9 taken from FAO (2026b), several recipient countries are highly exposed: remittance inflows originating from GCC countries represent about 14.5% of GDP in Nepal, 12% in Yemen, 6.5% in Pakistan and 5% in Bangladesh.
At the same time, prolonged instability in the Gulf could weaken labour demand and employment prospects for migrant workers, generating a second-round shock for remittance-receiving economies already facing higher fertilizer, energy, transport and food costs.
The stability of remittance corridors therefore appears central not only to migration dynamics but also to food security and macroeconomic resilience across the MENA region and its neighbouring economies.
Additionally, a tightening of global energy markets and rising uncertainty may also redirect agricultural inputs and land use towards biofuel production, thereby reducing the availability of food commodities and amplifying upward pressure on food prices
CHART 9 Main Countries Exposed to Remittance Losses (2021)
Transmission Channels and Food Price Dynamics
Building on these transmission channels, higher fertilizer and energy costs, together with remittance losses and potential shifts towards biofuel production are likely to amplify food price volatility at the global level. Chart 11 illustrates this dynamic by reporting the time trend of the Food and Agriculture Organization (FAO) Food Price Index (FFPI) over the same period. The FFPI is a composite indicator capturing monthly changes in international prices for a basket of goods, calculated as the weighted average of price indices for five product categories — cereals, oils and fats, dairy products, meat and sugar — weighted by their average export shares over 2014–2016. The indices for each category are based on the average of various world prices.
The FFPI remained relatively low from 2000 to 2003 before beginning to rise in early 2004, reaching 132.73 points in June 2008. The period 2007–2008, highlighted by the two dotted grey lines in the chart, was characterized by a global food price crisis. This episode reflected not only long-standing drivers of rising food prices — such as slower growth in agricultural productivity and grain stocks, higher energy costs increasing production expenses and rising demand from emerging economies — but also two distinctive features that set it apart from previous crises: increased speculation in financial markets and the diversion of food crops towards biofuel production.
Deregulation removed quantitative restrictions on speculative positions in agricultural futures contracts, which, instead of acting as stabilizers to reduce price volatility — encouraging investors to buy when prices were low and sell when high — became a key force behind the hyperinflation recorded for these products. The increase in demand from investor speculation exerted tremendous upward pressure on food and energy prices.
CHART 10 FAO Food Price Index Trend, 2000-2026
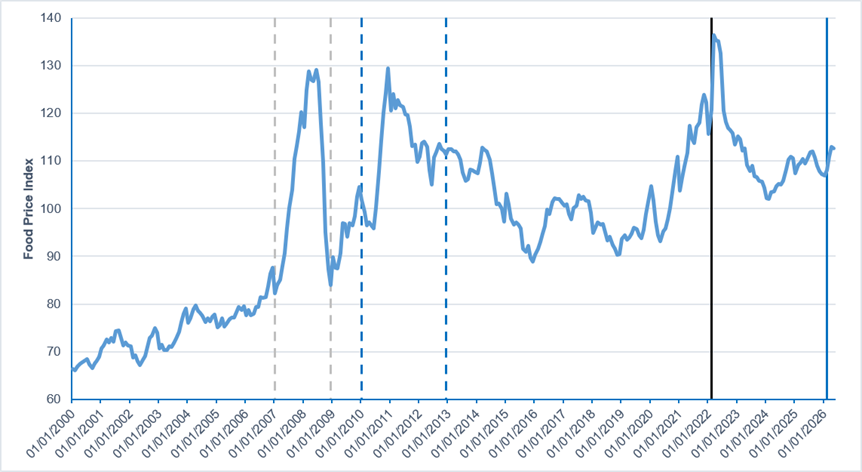
A second factor was the surge in demand for coarse grains for biofuel production in the United States and the European Union. Biofuels, together with low grain stocks, land-use shifts, speculative activity and export bans, have been linked to a 70–75% increase in food prices. Between 2002 and 2007, the quantity of US corn used for ethanol production increased by 53 million metric tons, accounting for 30% of the global growth in wheat and feed grain use (Trostle, 2008). The expansion of ethanol production thus reduced corn stock levels, driving prices upward — a factor that also contributed to food price increases during 2010–2012, as highlighted by the two blue dotted lines in the above chart. The Covid-19 pandemic disrupted food supply chains in many countries and globally, affecting harvesting, processing, trade and logistics with domestic food production gaps not easily compensated by imports because many countries reacted to the turmoil by imposing trade restrictions, such as tariffs and export bans, causing food prices to increase by 5.5% within a single year (August 2019–August 2020). An even stronger rise followed in the subsequent year: from December 2020, the index surpassed its previous peak of July 2014 and continued to grow until reaching its maximum in May 2021.
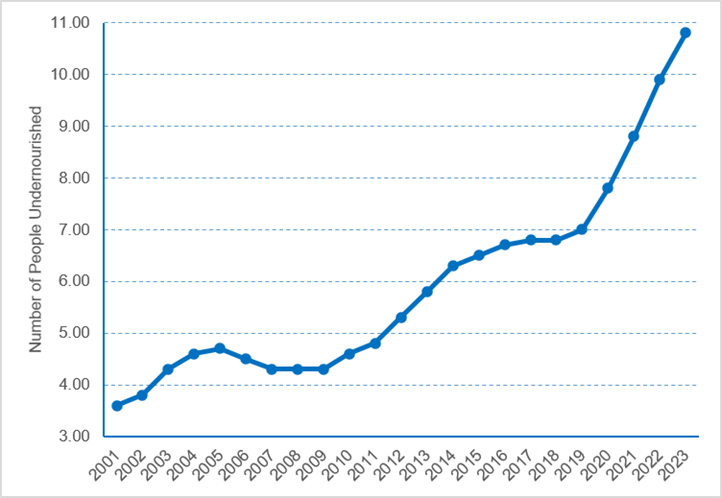
The onset of Russia’s aggression against Ukraine, marked by the continuous black line, contributed to a persistent increase in food prices by disrupting global trade in unprocessed cereals. The conflict involved two economies often described as the world’s “breadbaskets,” which together supplied more than 30% of globally consumed grains (UN, 2022), 17% of maize and 73% of sunflower oil, while accounting for over 10% of calories traded worldwide. These disruptions further exacerbated food security pressures in Egypt, where the number of people affected by undernourishment continued to rise, reaching nearly 11 million in 2023 (see Chart 11).
CHART 11 Number of People Undernourished (millions) (three-year average) Egypt Trend, 2001-2023
As shown in Chart 12, which reports the evolution of the FFPI components from early 2022 to May 2026, oils, fats and cereals were the main contributors to the increase in the overall index. Within the cereal component, wheat was the primary driver, with prices rising by more than 58 percent between March 2021 and the outbreak of the Russia–Ukraine conflict on 24 February 2022, from USD 268.80 to USD 425 per tonne for Ukrainian wheat exports (FPMA database).
CHART 12 Food Price Indices Trend, 2022-2026
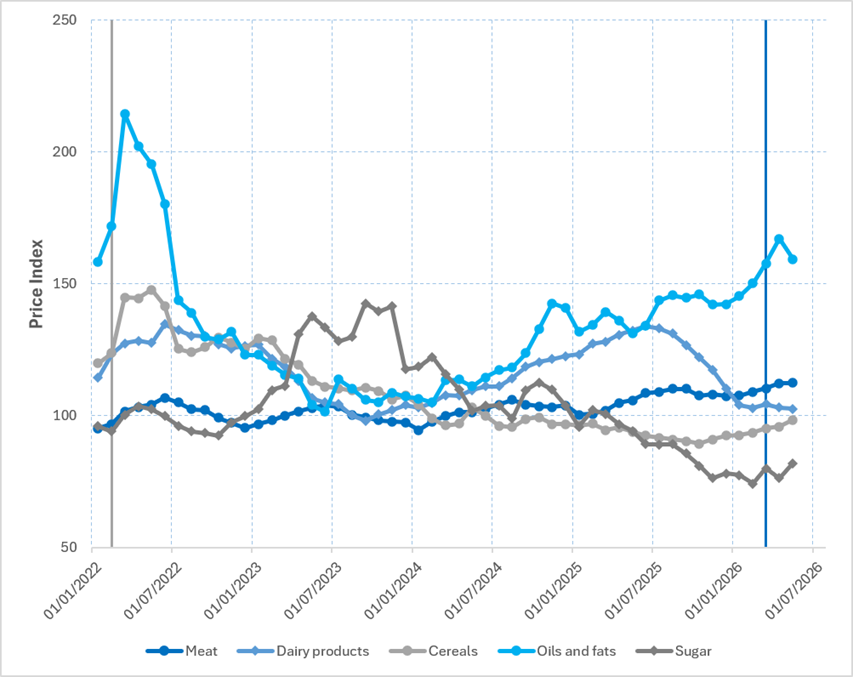
In contrast, the outbreak of the US–Iran conflict, marked by a vertical blue line in charts 10 and 12, generated only a modest increase in food prices, which remained well below the peak levels observed during the 2022 global food price spike. Nevertheless, this episode was associated with a positive price adjustment, reflecting renewed uncertainty in global commodity markets after a period of relative stability. As reported by FAO (2026b), “in early March, commodities like wheat, rice, corn and vegetable oils saw prices firming on international markets, exacerbated by panic buying and stockpiling. Volatility has increased but some commodities were on an upward trend before the beginning of the conflict.”
Conclusion
The current sequence of geopolitical, energy and food-market shocks has amplified long-standing structural vulnerabilities in the MENA region. The combination of higher fertilizer and energy prices, volatile cereal markets and rising uncertainty has reinforced the region’s exposure on both the production and consumption sides of the food system. Countries such as Egypt, Lebanon, Jordan and Tunisia face a dual dependency: on imported staple foods sourced from a small number of global breadbaskets, and on fertilizer-intensive agricultural systems that are highly sensitive to energy price fluctuations. At the same time, several GCC economies play a central role in global energy, fertilizer and labour markets, making the region a critical transmission node for global shocks.
These interconnections have translated into tangible welfare pressures across MENA economies. Recent spikes in food prices, driven by disruptions in fertilizer markets, are unfolding in a context already characterized by a reversal of earlier gains in food security, with undernourishment trends rising again after decades of gradual improvement. Furthermore, reliance on remittance inflows — especially in Jordan, Lebanon and Egypt — adds another layer of vulnerability, as these flows depend on labour demand conditions in GCC economies. Finally, the interaction between energy markets and agricultural inputs, including potential shifts towards biofuel production, risks further tightening global food supply and amplifying food price volatility.
In the short term, stabilizing these interconnected systems requires a combination of targeted and operational measures. As emphasized by FAO (2026b) recommendations, maintaining alternative trade routes, strengthening real-time market monitoring and providing targeted support to highly import-dependent countries are essential to prevent acute supply disruptions. At the same time, financial assistance to farmers can help sustain fertilizer use and production levels, limiting immediate yield declines. These interventions are particularly relevant for MENA economies that rely heavily on imported cereals and fertilizer inputs, where even short-lived disruptions can quickly translate into domestic food insecurity.
Over the medium to long term, reducing vulnerability will require deeper structural adjustments. Diversifying import sources, strengthening regional coordination mechanisms and improving contingency planning can reduce exposure to concentrated trade risks. More fundamentally, expanding domestic agricultural capacity, investing in sustainable fertilizer production and accelerating renewable energy transitions can help decouple food systems from volatile fossil fuel markets. Lastly, diplomatic efforts aimed at de-escalating tensions and safeguarding freedom of navigation in strategic chokepoints such as the Strait of Hormuz remain crucial, as they underpin the stability of both global energy and food markets and complement the broader set of policy responses.
References
Caldara, D. & Iacoviello, M. “Measuring Geopolitical Risk.” American Economic Review, April, 112(4), 2022, 1194-1225.
Food and Agriculture Organization (FAO). Detailed trade matrix (fertilizers). FAOSTAT, 2026a. [Accessed on 4 July 2026]. www.fao.org/faostat/en/#data/RFM.
Food and Agriculture Organization. (FAO). Global agrifood implications of the 2026 conflict in the Middle East: Impacts on energy and fertilizer trade, and food security. 2026b. www.fao.org/agrifood-economics/publications/detail/en/c/1758065/.
International Energy Agency (IEA). Strait of Hormuz Factsheet. IEA, 2026. [Cited 5 July 2026]. www.iea.org/about/oil-security-andemergency-response/strait-of-hormuz.
Odjo, S.; Traoré, F. & Zaki, C. (Eds.). Africa Agriculture Trade Monitor 2025. AKADEMIYA2063; International Food Policy Research Institute (IFPRI) 2025.
Trostle, R. Global agricultural supply and demand: Factors contributing to the recent increase in food commodity prices (WRS-0801). USDA, 2008.
UN Global Crisis Response Group on Food, Energy and Finance. Global impact of war in Ukraine on food, energy and finance systems: Brief No. 1. United Nations, 2022. https://doi.org/10.18356/29589304-1.
United Nations Trade and Development UNCTAD. Building sustainable food supply chains through trade policy in Western Asia and Northern Africa. United Nations, 2025.
[1] This research was carried out within the framework of the STAPLES project. The STAPLES project is part of the PRIMA programme, supported by the European Union under Grant Agreement No. 2333. Views and opinions expressed are those of the author(s) only and do not necessarily reflect those of the PRIMA Foundation or the European Union, and neither of them can be held responsible for the information contained.
Header photo: Gizem Toprak / Pexels